My clients have heard me repeatedly say that investors who are patient and disciplined are more likely to be rewarded over the long term. That’s why we construct broadly diversified portfolios designed with each client’s long-term goals and needs in mind. Instead of trying to chase the next “hot” stock or figure out which sector will be the top performer in any given period, we establish a portfolio with assets distributed as efficiently as possible across as many sectors as possible, and then we allow the markets to work for clients, rather than against them.
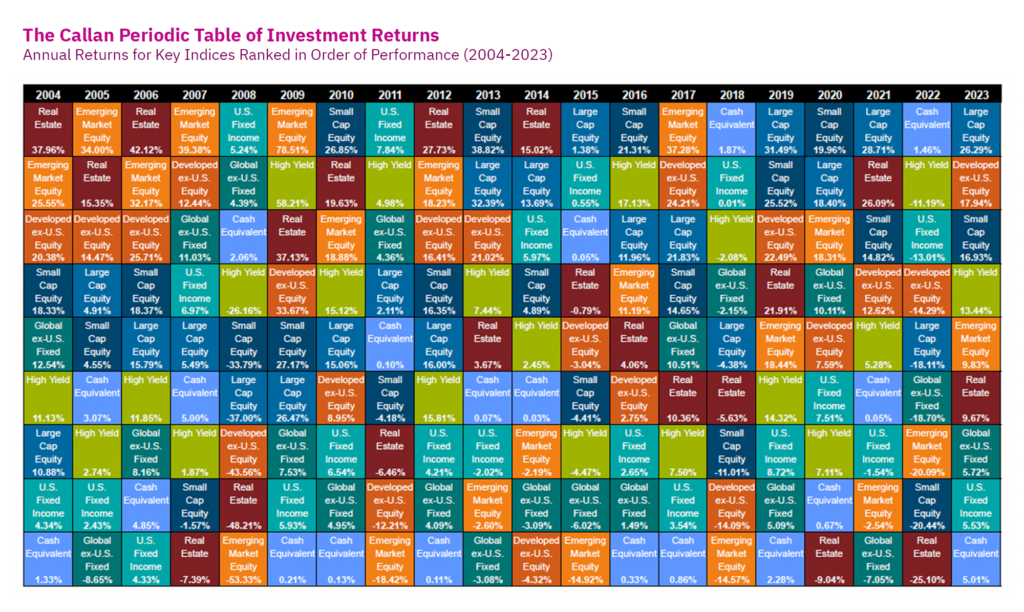
One of the best ways to understand this principle is by looking at a chart called the Callan Periodic Table of Investments. Like the familiar periodic table of the elements that we all remember (sort of) from high school chemistry, the Callan table groups all the major investment types – from cash to emerging market stocks – and charts their returns over varying periods of time. For example, the following illustration shows the Callan table for each single-year period from 2004–2023, with returns shown for all the asset types. The highest-performing assets are at the top, and the lowest at the bottom. Each color block represents a different type of asset, and the chart includes non-U.S. investments as well as domestic.

Source: Kloepfer, Jay. “Callan Periodic Table of Investment Returns: Year-End 2023.” Callan, 10 January 2024.
So, in this chart, the top-performing sector in 2004 was real estate, with a total return for the year of 37.96%. The worst-performing sector that year was cash or cash equivalents, at 1.33%. In 2023, the top performer was large-capitalization equities (26.29%), while cash was again at the bottom of the heap 5.01%). You can look along each row of the chart and notice that the relative positions of the “winners” and “losers” changes almost every year. Global equities in emerging markets may produce the highest returns one year, while the next year, large-capitalization U.S. companies could take the lead.
Is there an obvious pattern, from one year to the next? (Hint: if you said “no,” you would be correct). The Callan Periodic Table illustrates what I tell my clients: no one can predict the price movement of any asset group during a particular period with any reasonable accuracy. This year’s winner may be next year’s loser. This is why we build broadly diversified portfolios.
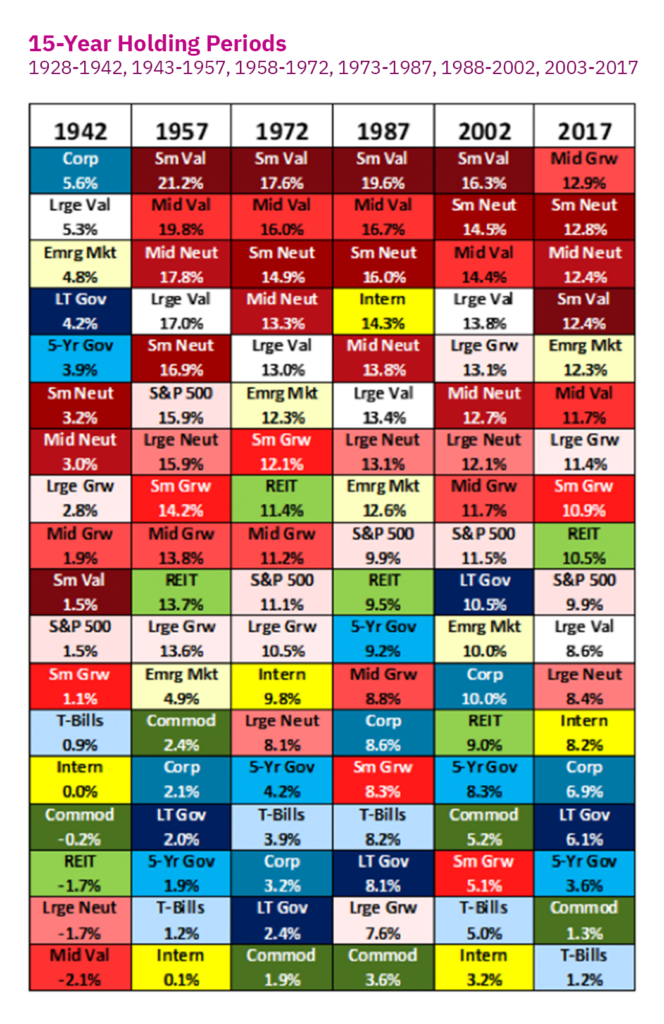
But when we stretch the time frame, something interesting begins to happen. For example, take a look at the returns exhibited by holding assets for 15-year periods, as analyzed in an important study published in 2018 by researchers Stephen Huxley and Brent Burns.

Source: Huxley, Stephen J., and Brent Burns. “The Illusion of Extrapolating Randomness from Periodic Tables.” Asset Dedication, LLC. Accessed 2 October 2024.
When the holding period for assets is extended from one year to 15 years (as shown in the table for periods ending in 1942, 1957, 1972, 1987, 2002, and 2017), a new pattern emerges that isn’t visible in the single-year analysis. Over these 15-year periods, equity investments – particularly stocks – tend to dominate the top performers. Notably, most of the top positions are held by small-capitalization value stocks, representing smaller companies whose shares trade at lower prices relative to their book value.
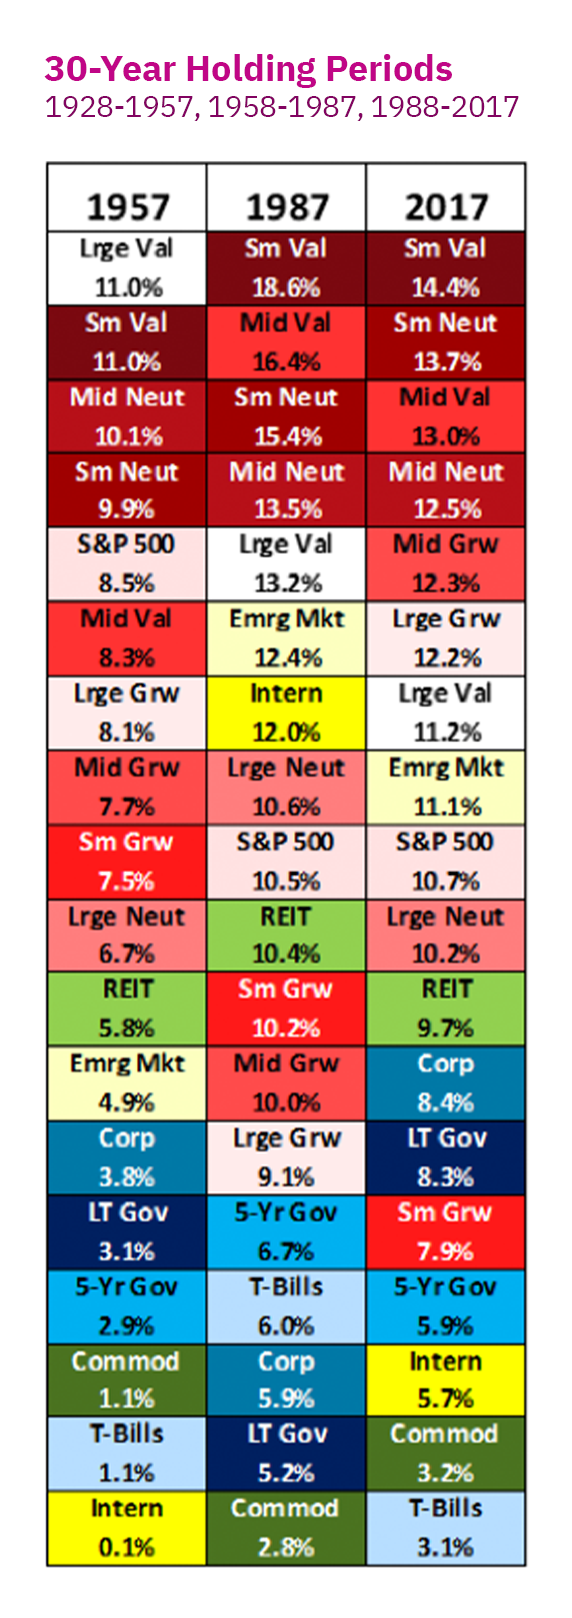
What would happen if we extended the holding period even more – say, to 30 years? Let’s take a look:

Source: Huxley, Stephen J., and Brent Burns. “The Illusion of Extrapolating Randomness from Periodic Tables.” Asset Dedication, LLC. Accessed 2 October 2024.
By this point, a pattern begins to emerge. Equity investments, and particularly small-capitalization and value stocks, may generally outperform other asset classes over the long haul.
What does this mean for investors?
First, it means that your portfolio must be constructed with an appropriate time frame in mind. For a younger person who is investing for retirement in 20 to 30 years, it may be important to allocate a larger percentage of the asset mix to equity investments to help achieve the type of long-term growth needed to provide for a secure retirement. For those who are closer to retirement and do not have the luxury of a long timeframe to recover from a period of falling equity prices, it will usually be more important to allocate a larger portion of the asset mix toward more conservative investments like bonds or, in certain cases, real estate. That is why each client’s portfolio and diversification strategy must be uniquely designed with their age, goals, and risk tolerance in mind.
But over longer time frames, equities may be expected to outperform most other asset classes. That is why, even for more conservative investors, it is usually advisable to have some portion of assets allocated to stocks, simply to help ensure that the portfolio will continue to have growth potential characteristics sufficient to provide for the longer life spans that are more and more typical.
The most important takeaway, though, is the value of patience and discipline. When your portfolio is properly diversified, you can be best served by sticking to your long-term plan. Investors who can “tune out the noise” and stay their course will likely, in most cases, do well over the long term. It’s important, then, to try and avoid being distracted by short-term movements in the financial markets. Making an important financial decision based on such short-term data would be like trying to figure out the picture formed by a jigsaw puzzle when you can only see a single piece. Instead, taking the long-term view allows you to see more of the picture and usually leads to better portfolio performance.
Making decisions about your investment strategy can be confusing, especially if you are not familiar with the basic principles of the markets. As a fiduciary financial advisor, my job is to provide my clients with the reliable, time- and market-tested information they need to become informed investors. In the current market environment – as with most market environments – it’s important to be well informed, patient, and strategic. For more information, contact your wealth advisor. And if you are not a client, let’s talk.


