With only two weeks until the general election, it’s natural that many investors might have energy prices on their mind. It’s a common trope to look at a president’s economic success through the lens of gas prices. So, let’s take stock of gas prices and see what they’re really telling us right now.
Where are prices now?
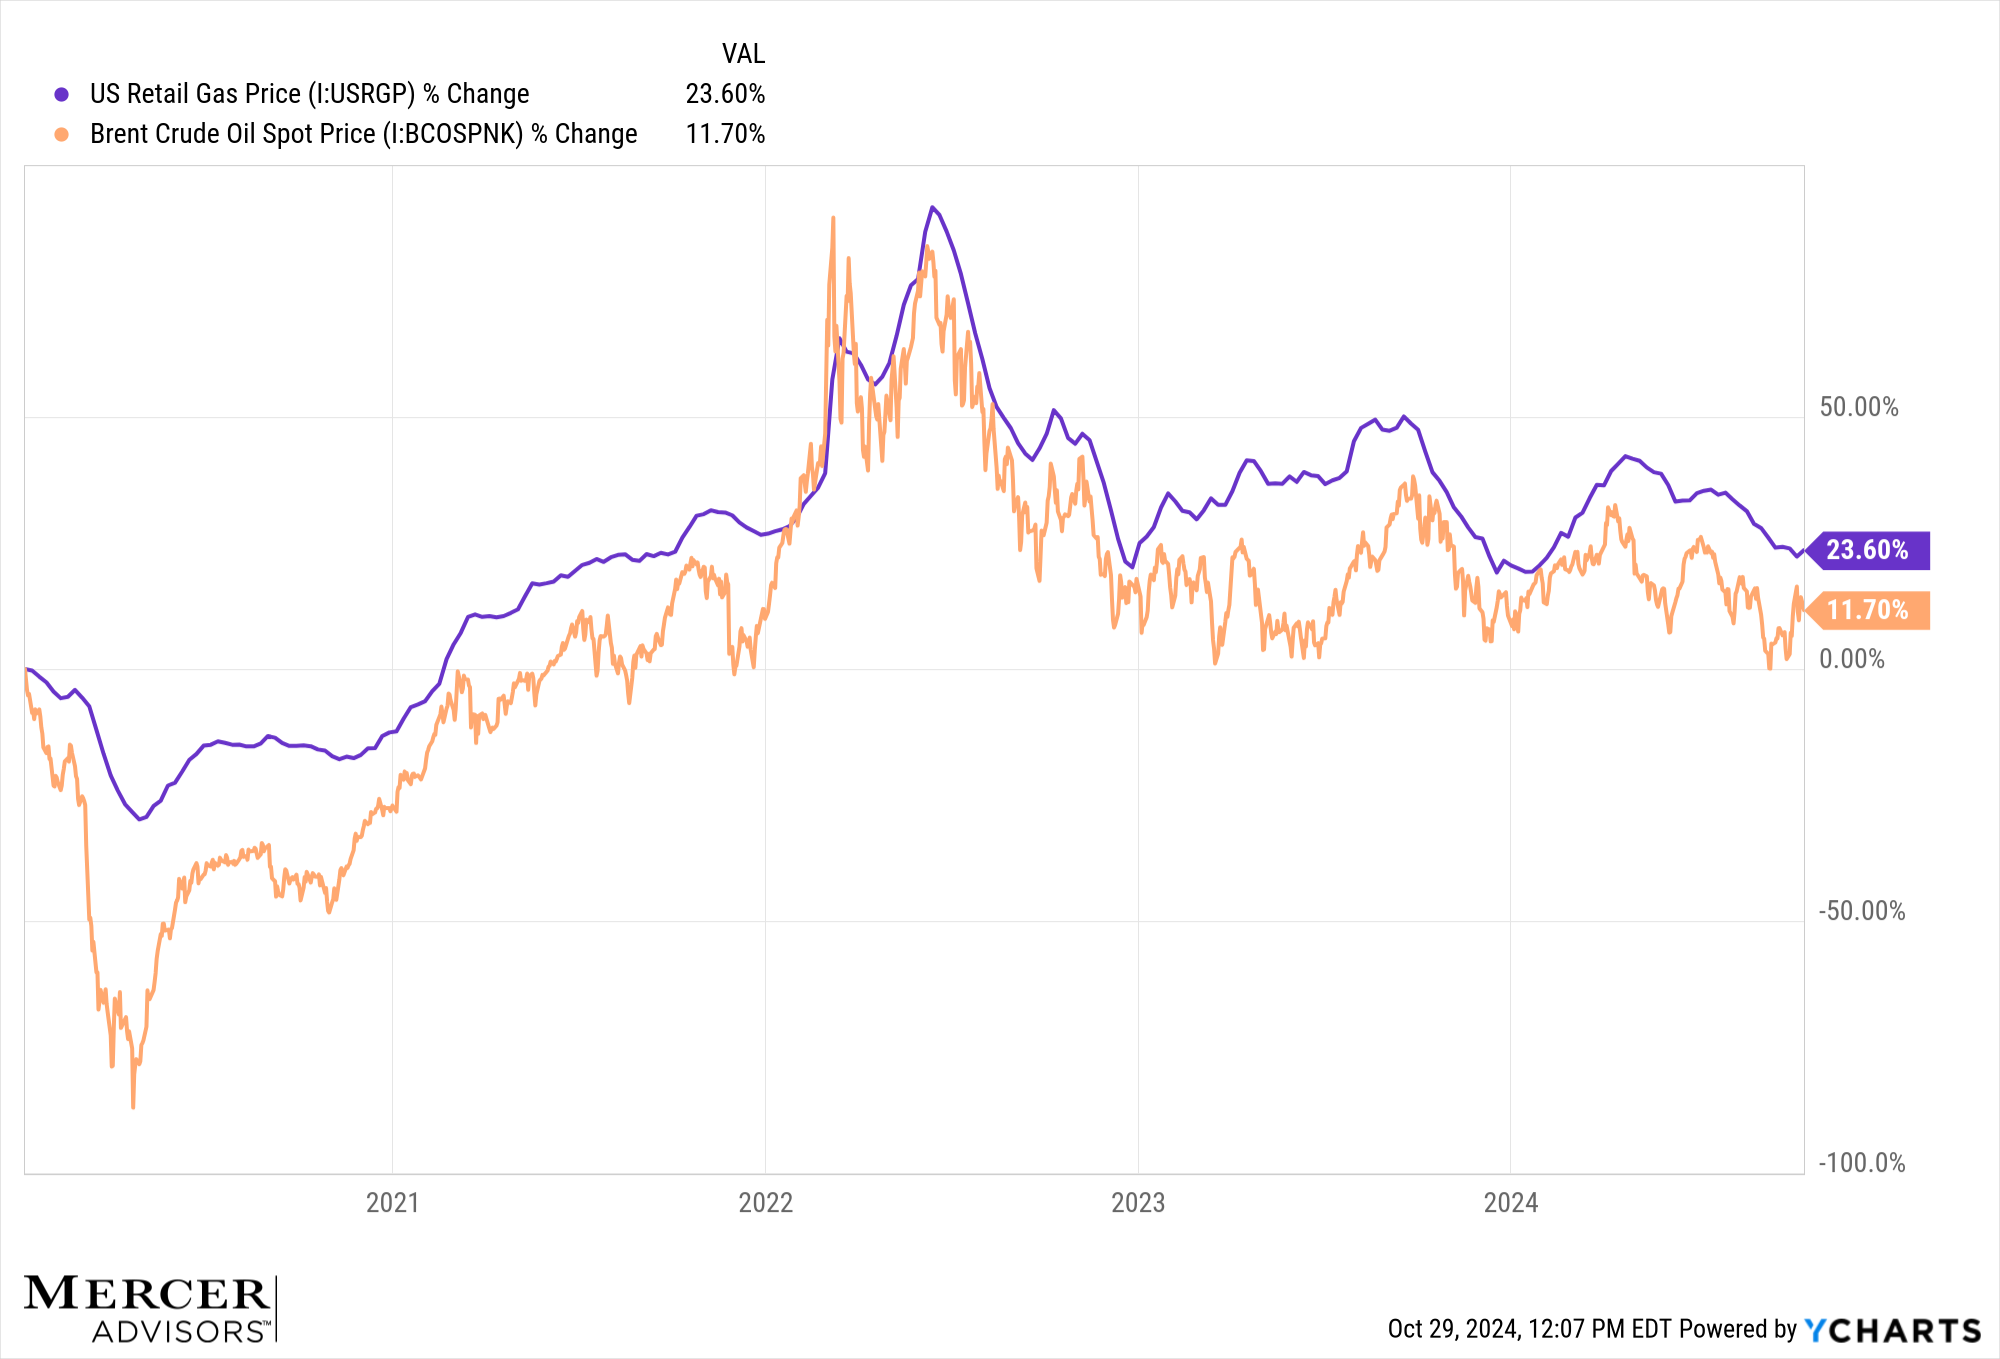
Looking over the past 4 or 5 years, there’s no question that prices are higher. Compared to January of 2020 – just before the pandemic threw a wrench into the global economy – U.S. retail gas prices are 22% higher. The price of oil is up 16%. Right now, the average price for regular unleaded gas, nationwide, is about $3.15 a gallon. There’s a lot of regional variation in that. Gas is almost always cheaper in the south and it’s long been far more expensive in places like California and Pennsylvania due to high taxes on gasoline. But it’s indeed up.

Source: YCharts
What have been the drivers of gas prices?
Looking over the past three years, the biggest thing that stands out – very clearly in hindsight – is an enormous gas price spike in early 2022 that coincided with Russia’s invasion of Ukraine. Oil and gasoline markets promptly adjusted in response to unexpected supply disruptions and an international effort to cut Russia off from the international financial system. However, as impactful as Russia’s invasion was, markets and supply chains have now had time to adjust. Gas prices have remained persistently higher than before the war, so there’s likely still more to the story.
Can we blame a lack of U.S. oil production?
Some wonder whether the U.S. simply isn’t producing enough oil – if somehow oil production has perhaps declined over the past 4-5 years. This argument, however, is hard to reconcile with the facts.
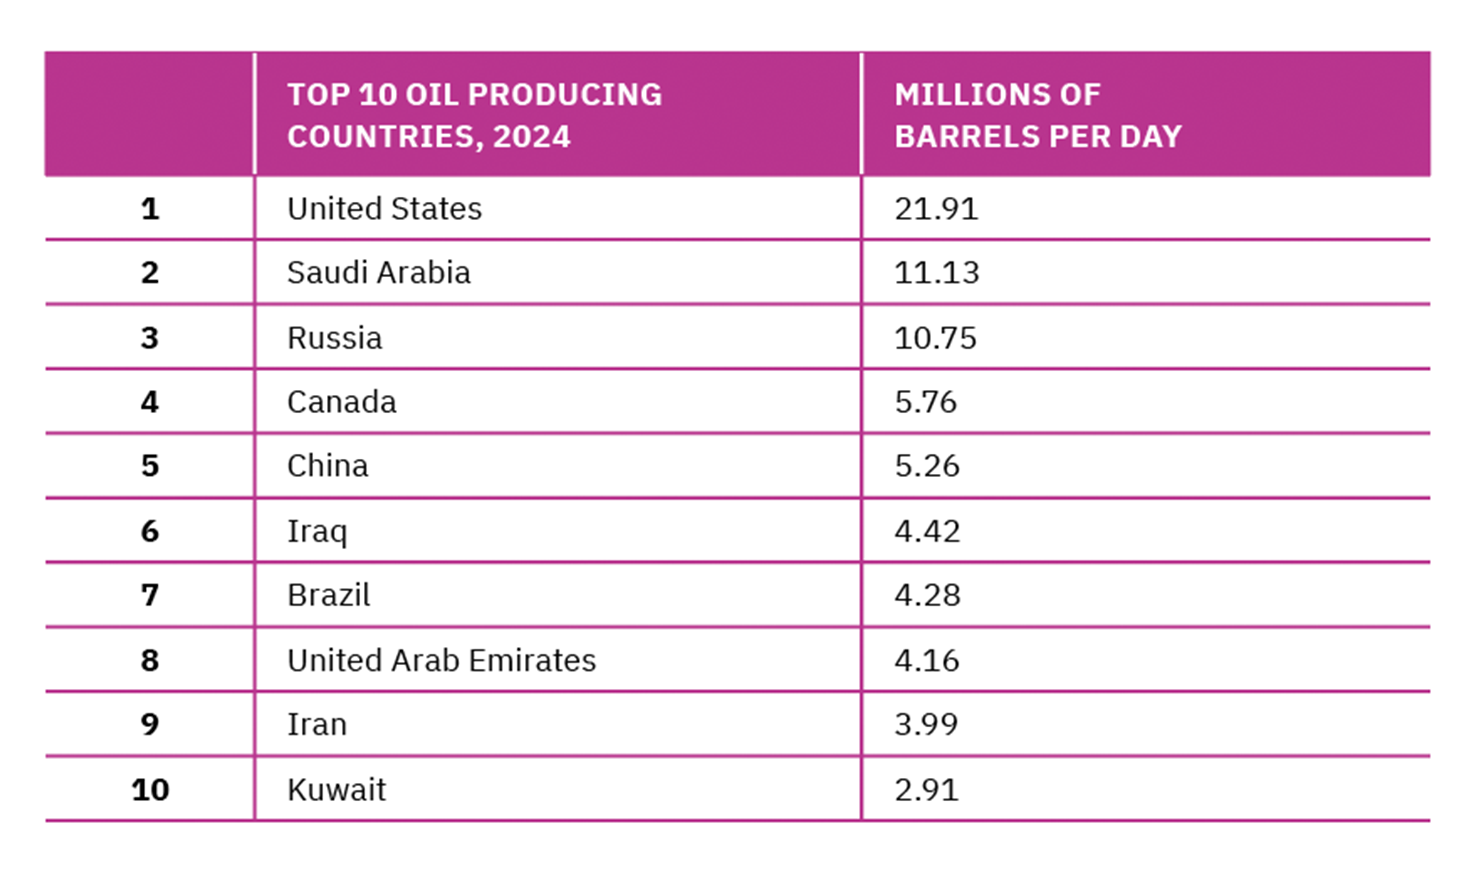
Today, the U.S. produces about 18% more oil than it did in 2019 – that’s nearly 22 million barrels of oil per day. Saudi Arabia, by contrast, produces about 11 million barrels of oil per day. That means the U.S. produces approximately twice as much oil as Saudi Arabia and is the world’s leading oil producer. Importantly, the U.S. consumes about 20.5 million barrels of oil per day, meaning the U.S. is not only the leading producer, but it produces more than it consumes.

Source: Energy Information Agency
How do energy prices compare to overall inflation?
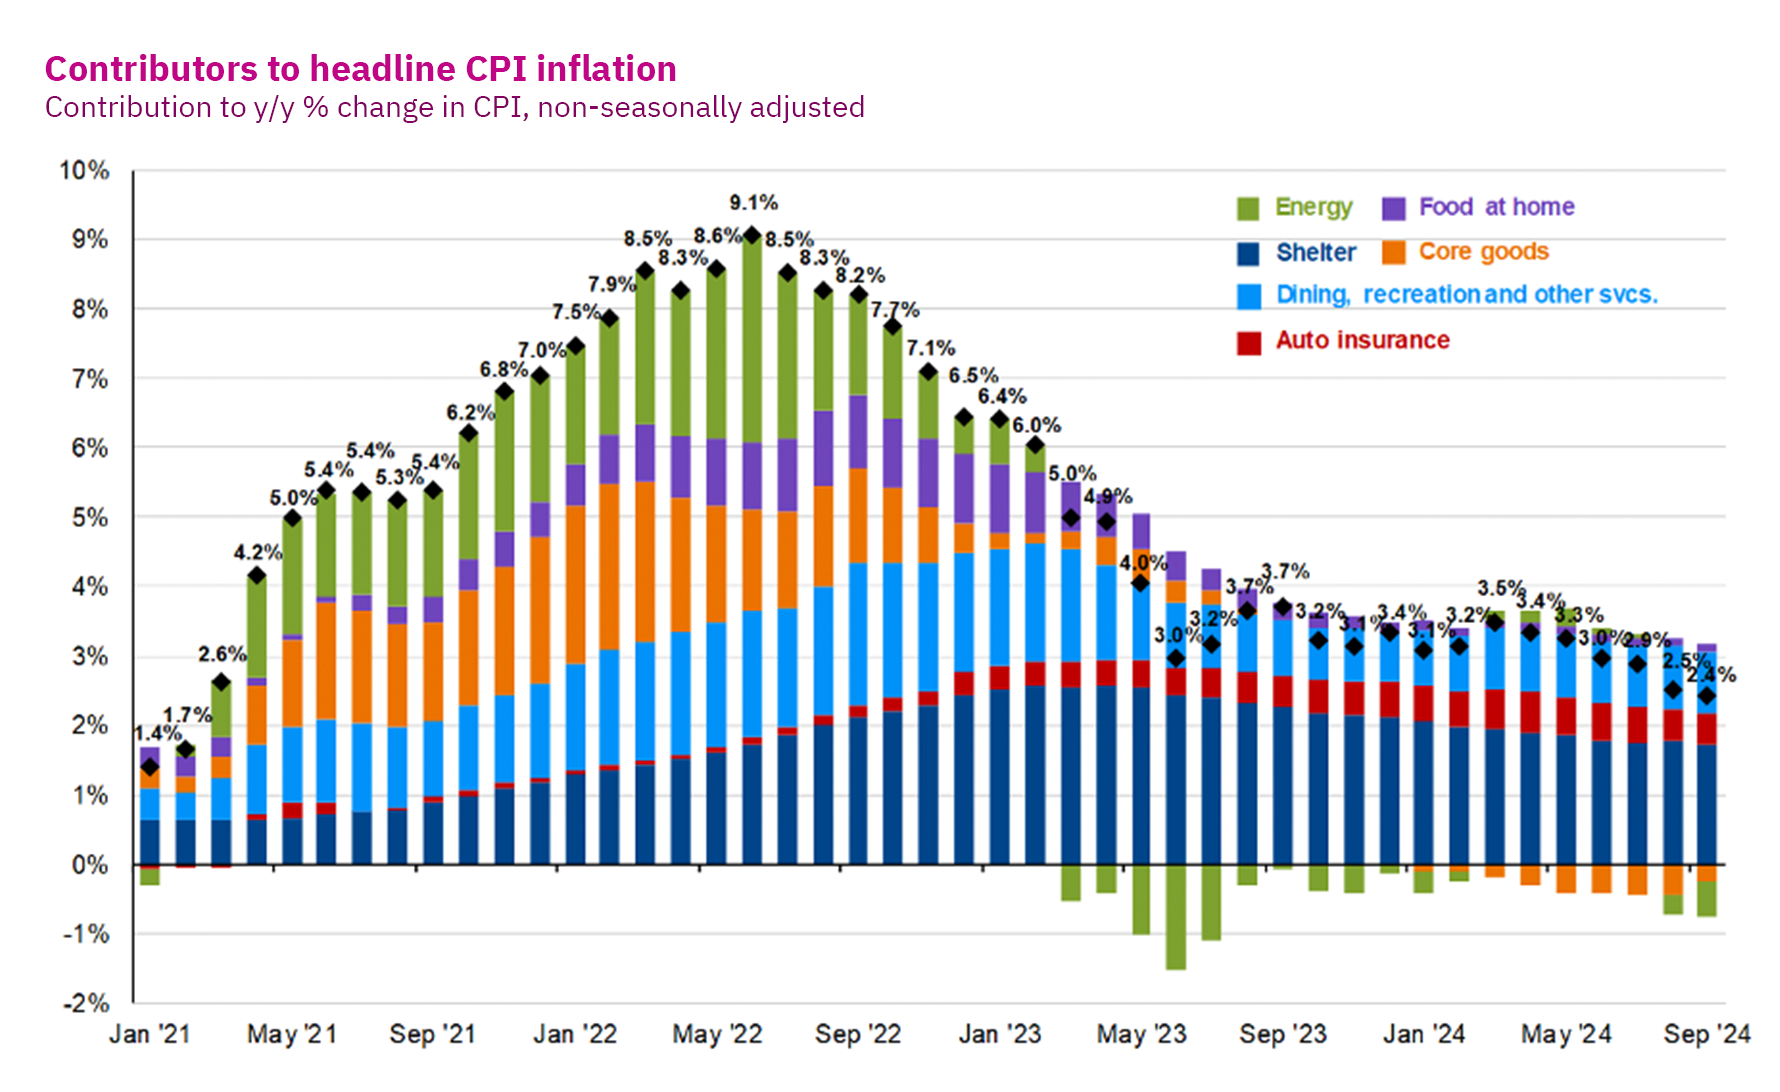
Gas prices are up about 22% since before the pandemic. What has inflation done over that period? As it happens, the overall price level is also about 22% higher than it was in January of 2020. By that measure, we could say that energy prices, adjusted for inflation, aren’t any higher today relative to consumer prices overall. The point is that after the spike from Russia’s invasion of Ukraine, it appears energy prices have broadly kept pace with inflation since 2020.

Source: JPMorgan Guide to the Markets
What, then, is behind the inflation we’ve experienced since 2021?
Given gas prices seem to have ultimately kept pace with inflation, it makes sense to zoom out a bit and examine the causes of inflation more broadly.
Looking at the trajectory of inflation over recent years also points to a primary culprit – the COVID-19 pandemic and its disruptive impact on the global economy. This isn’t to say that the administration or the Federal Reserve didn’t commit policy mistakes (they likely did, in hindsight). While low interest rates and government borrowing certainly increased demand (in an attempt to stave off a massive deflationary spiral in March 2020), it’s important to remember that prices are naturally a function of both supply and demand.
It’s no coincidence that the uptick in inflation coincided with the rapid — and powerful — reopening of U.S. economy throughout 2021 as pent-up demand was unleashed as new, more effective vaccines became widely available. However, this surge in demand also coincided with Chinese President Xi Jinping’s announcement of a new “zero-COVID policy” in China, effectively shuttering the world’s largest producer of manufacturing goods — resulting in a massive reduction in the supply of everything from iPhones to Legos. Economics 101 tells us that when demand goes up and supply goes down, prices rise —often significantly.
Put simply: The 2021–2023 was a period of significant consumer demand that coincided with a major decline in the supply of goods and services. It is the perfect recipe for a major, broad-based increase in prices.
One obvious reason why it’s unlikely that U.S. government policy alone led to high inflation is that the inflationary spike of 2021-2023 was not limited to the United States. It was a global phenomenon impacting countries the world over. While policy errors no doubt contributed to inflation (the trillions of dollars borrowed and spent by both the Trump and Biden administrations contributed to demand), it seems highly unlikely that U.S. government policy errors are uniquely responsible for inflation nearly everywhere around the globe. In the aggregate, it was pent-up demand combined with massive supply chain disruptions, that together contributed the inflationary spike of the past few years.
Final thoughts
It’s tempting for human beings to look for simple explanations to complex problems; it’s even more tempting to do so during a close election that’s been reduced to political soundbites. But the global economy is infinitely complex and rarely do simple cause-and-effect relationships explain global trends like inflation and gas prices. As investors, we should at all times be skeptical of political soundbites and simplistic cause-and-effect arguments. In contrast, we should look beyond the soundbites, keep politics out of our portfolios, and remain committed to a disciplined and diversified approach to capturing long-term market returns.
For more on why investing and politics don’t mix, listen to our recent podcast on the topic.
Not a Mercer Advisors client but interested in more information? Let’s talk.

Home » Insights » Market Commentary » Energy Prices on the Eve of the Election: Insights From Our CIO
Energy Prices on the Eve of the Election: Insights From Our CIO
Donald Calcagni, MBA, MST, CFP®, AIF®
Chief Investment Officer
Gas and energy prices are up from four years ago. We examine the factors behind the increase.
With only two weeks until the general election, it’s natural that many investors might have energy prices on their mind. It’s a common trope to look at a president’s economic success through the lens of gas prices. So, let’s take stock of gas prices and see what they’re really telling us right now.
Where are prices now?
Looking over the past 4 or 5 years, there’s no question that prices are higher. Compared to January of 2020 – just before the pandemic threw a wrench into the global economy – U.S. retail gas prices are 22% higher. The price of oil is up 16%. Right now, the average price for regular unleaded gas, nationwide, is about $3.15 a gallon. There’s a lot of regional variation in that. Gas is almost always cheaper in the south and it’s long been far more expensive in places like California and Pennsylvania due to high taxes on gasoline. But it’s indeed up.
Source: YCharts
What have been the drivers of gas prices?
Looking over the past three years, the biggest thing that stands out – very clearly in hindsight – is an enormous gas price spike in early 2022 that coincided with Russia’s invasion of Ukraine. Oil and gasoline markets promptly adjusted in response to unexpected supply disruptions and an international effort to cut Russia off from the international financial system. However, as impactful as Russia’s invasion was, markets and supply chains have now had time to adjust. Gas prices have remained persistently higher than before the war, so there’s likely still more to the story.
Can we blame a lack of U.S. oil production?
Some wonder whether the U.S. simply isn’t producing enough oil – if somehow oil production has perhaps declined over the past 4-5 years. This argument, however, is hard to reconcile with the facts.
Today, the U.S. produces about 18% more oil than it did in 2019 – that’s nearly 22 million barrels of oil per day. Saudi Arabia, by contrast, produces about 11 million barrels of oil per day. That means the U.S. produces approximately twice as much oil as Saudi Arabia and is the world’s leading oil producer. Importantly, the U.S. consumes about 20.5 million barrels of oil per day, meaning the U.S. is not only the leading producer, but it produces more than it consumes.
Source: Energy Information Agency
How do energy prices compare to overall inflation?
Gas prices are up about 22% since before the pandemic. What has inflation done over that period? As it happens, the overall price level is also about 22% higher than it was in January of 2020. By that measure, we could say that energy prices, adjusted for inflation, aren’t any higher today relative to consumer prices overall. The point is that after the spike from Russia’s invasion of Ukraine, it appears energy prices have broadly kept pace with inflation since 2020.
Source: JPMorgan Guide to the Markets
What, then, is behind the inflation we’ve experienced since 2021?
Given gas prices seem to have ultimately kept pace with inflation, it makes sense to zoom out a bit and examine the causes of inflation more broadly.
Looking at the trajectory of inflation over recent years also points to a primary culprit – the COVID-19 pandemic and its disruptive impact on the global economy. This isn’t to say that the administration or the Federal Reserve didn’t commit policy mistakes (they likely did, in hindsight). While low interest rates and government borrowing certainly increased demand (in an attempt to stave off a massive deflationary spiral in March 2020), it’s important to remember that prices are naturally a function of both supply and demand.
It’s no coincidence that the uptick in inflation coincided with the rapid — and powerful — reopening of U.S. economy throughout 2021 as pent-up demand was unleashed as new, more effective vaccines became widely available. However, this surge in demand also coincided with Chinese President Xi Jinping’s announcement of a new “zero-COVID policy” in China, effectively shuttering the world’s largest producer of manufacturing goods — resulting in a massive reduction in the supply of everything from iPhones to Legos. Economics 101 tells us that when demand goes up and supply goes down, prices rise —often significantly.
Put simply: The 2021–2023 was a period of significant consumer demand that coincided with a major decline in the supply of goods and services. It is the perfect recipe for a major, broad-based increase in prices.
One obvious reason why it’s unlikely that U.S. government policy alone led to high inflation is that the inflationary spike of 2021-2023 was not limited to the United States. It was a global phenomenon impacting countries the world over. While policy errors no doubt contributed to inflation (the trillions of dollars borrowed and spent by both the Trump and Biden administrations contributed to demand), it seems highly unlikely that U.S. government policy errors are uniquely responsible for inflation nearly everywhere around the globe. In the aggregate, it was pent-up demand combined with massive supply chain disruptions, that together contributed the inflationary spike of the past few years.
Final thoughts
It’s tempting for human beings to look for simple explanations to complex problems; it’s even more tempting to do so during a close election that’s been reduced to political soundbites. But the global economy is infinitely complex and rarely do simple cause-and-effect relationships explain global trends like inflation and gas prices. As investors, we should at all times be skeptical of political soundbites and simplistic cause-and-effect arguments. In contrast, we should look beyond the soundbites, keep politics out of our portfolios, and remain committed to a disciplined and diversified approach to capturing long-term market returns.
For more on why investing and politics don’t mix, listen to our recent podcast on the topic.
Not a Mercer Advisors client but interested in more information? Let’s talk.
Mercer Advisors Inc. is a parent company of Mercer Global Advisors Inc. and is not involved with investment services. Mercer Global Advisors Inc. (“Mercer Advisors”) is registered as an investment advisor with the SEC. The firm only transacts business in states where it is properly registered or is excluded or exempted from registration requirements.
All expressions of opinion reflect the judgment of the author as of the date of publication and are subject to change. Some of the research and ratings shown in this presentation come from third parties that are not affiliated with Mercer Advisors. The information is believed to be accurate but is not guaranteed or warranted by Mercer Advisors. Content, research, tools and stock or option symbols are for educational and illustrative purposes only and do not imply a recommendation or solicitation to buy or sell a particular security or to engage in any particular investment strategy. For financial planning advice specific to your circumstances, talk to a qualified professional at Mercer Advisors.
Past performance may not be indicative of future results. Therefore, no current or prospective client should assume that the future performance of any specific investment, investment strategy or product made reference to directly or indirectly, will be profitable or equal to past performance levels. All investment strategies have the potential for profit or loss. Changes in investment strategies, contributions or withdrawals may materially alter the performance and results of your portfolio. Different types of investments involve varying degrees of risk, and there can be no assurance that any specific investment will either be suitable or profitable for a client’s investment portfolio. Diversification does not ensure a profit or guarantee against loss. Historical performance results for investment indexes and/or categories, generally do not reflect the deduction of transaction and/or custodial charges or the deduction of an investment-management fee, the incurrence of which would have the effect of decreasing historical performance results. Economic factors, market conditions, and investment strategies will affect the performance of any portfolio and there are no assurances that it will match or outperform any particular benchmark.
This document may contain forward-looking statements including statements regarding our intent, belief or current expectations with respect to market conditions. Readers are cautioned not to place undue reliance on these forward-looking statements. While due care has been used in the preparation of forecast information, actual results may vary in a materially positive or negative manner. Forecasts and hypothetical examples are subject to uncertainty and contingencies outside Mercer Advisors’ control.
Certified Financial Planner Board of Standards, Inc. (CFP Board) owns the CFP® certification mark, the CERTIFIED FINANCIAL PLANNER® certification mark, and the CFP® certification mark (with plaque design) logo in the United States, which it authorizes use of by individuals who successfully complete CFP Board’s initial and ongoing certification requirements.
Explore More
A Reversal for the Magnificent Seven
Investing Opportunities in Chaotic Markets
Watching the Market’s Weakness: Insights from Our CIO