As we enter the home stretch of the presidential election between now and early November, it’s worth taking a moment to consider what the data shows us about investment returns, elections, and political parties. It’s a good time to turn to the data, because elections and politics are highly emotional, and when emotions run high, we don’t always make the best investment decisions.
It’s natural for us to deeply believe that our preferred candidate or political party is best for markets and the economy. It’s also natural to believe, when policy platforms are so different, that the impact on markets will be both obvious and significant. It’s easy, and all too common, for our overconfidence biases to have us think that we can somehow reliably predict who will win the election and, subsequently, who the winners and losers in our portfolios might be.
However, all of this is wrong. The data is ambiguous, at best, that one political party is any better than the other for markets or the economy.
The data
Since the 1928 presidential election, the S&P 500 Index has delivered an average annual return of 11.57% during election years and 10.67% the year after the election. More broadly, as the below chart shows, financial markets have generally trended upward under both Democratic and Republican administrations.

Source: Dimensional.
Past performance is not a guarantee of future results. Indices are not available for direct investment; therefore, their performance does not reflect the expenses associated with the management of an actual portfolio. Data presented in the growth of $1 chart is hypothetical and assume reinvestment of income and no transaction costs or taxes. The chart is for illustrative purposes and only and is not indicative of any investment.
Source: S&P data ©2024 S&P Dow Jones Indices LLLC, a division of S&P Global. All rights reserved.
Why might the link between politics and markets be so hard to find?
There is a plethora of reasons why there’s candidly no reliable correlation between which party controls the White House and market returns. The president is but one branch of government and it’s ultimately Congress that writes and passes legislation and sets spending policy.
There’s inevitably a gap between what a president proposes in a policy platform, and what they’re subsequently able to enact. Even when Congress and the White House are controlled by the same party, they don’t always agree on how to enact their policies.
Many key economic policies remain largely unchanged from one presidency to the next.
Some key policymakers, such as the Federal Reserve’s governors, are appointed to terms that don’t line up with the political calendar. Even when the occupant of the White House changes, there’s much about the economy that remains the same.
Are there any reliable historical patterns that emerge?
It’s possible to cherry pick historical data to find something that might support your cause. Consider the first chart, below. It’s relatively rare for both Congress and the White House to be controlled by the same party (the government has been divided 61% of the time). But during those periods of Democratic control, real GDP has grown 4% on average, vs. just 2.8% during the periods of Republican control.
But then consider the second chart – under periods of unified Republican control, the market has increased 12.9% vs. just 9.3% under Democrats.
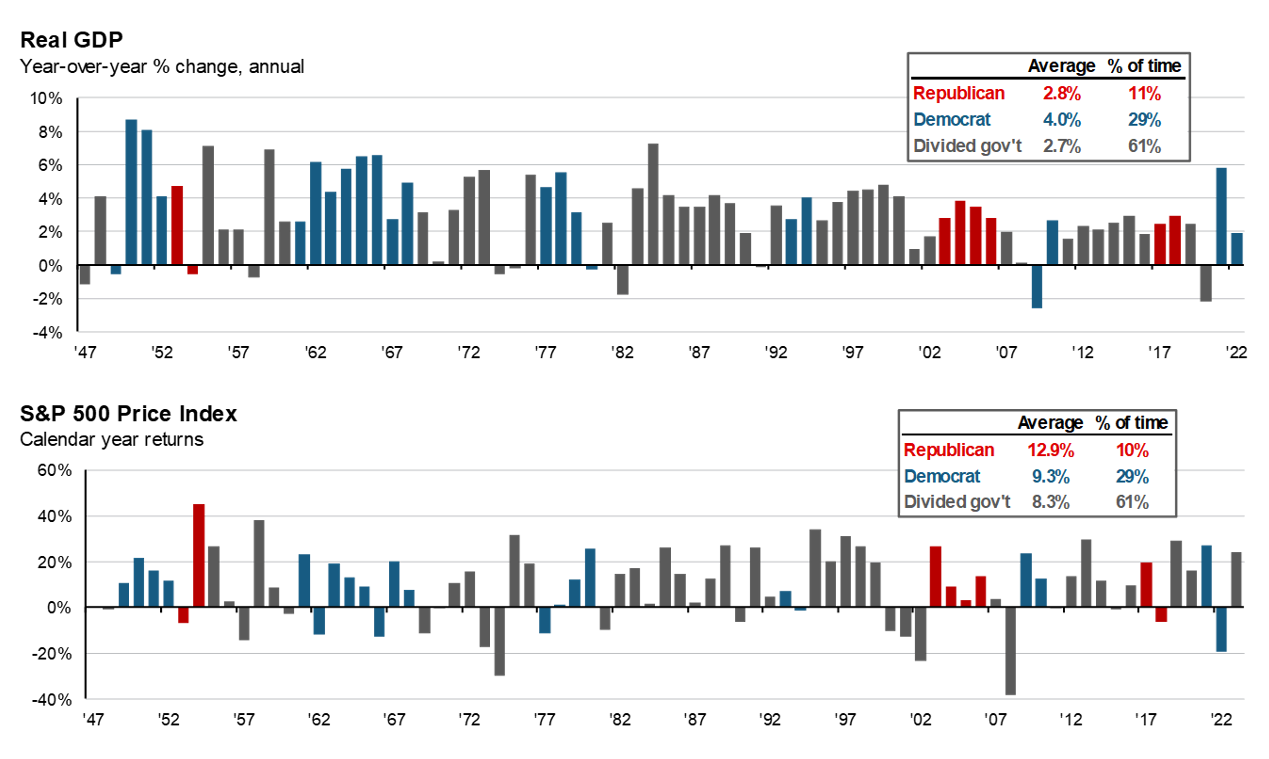
Source: Mercer Advisors Q3 Market Outlook
Note: Indexes are not available for direct investment. Past performance is not a guarantee of future results.
Source: BEA, Standard & Poor’s, FactSet, J.P. Morgan Asset Management. Data is calendar year. Guide to the Markets – U.S. Data are as of January 18, 2024.
What’s important to takeaway here is that none of this implies any reliable cause and effect relationship between party control and market returns or GDP growth. These periods of unified government leave us only a small sample size. And remember that control of Congress can even change in between election cycles, as happened in 2001 when Senator Jim Jeffords of Vermont left his party, causing control of the Senate to flip.
In addition to being a small sample size, it might be wrong to conclude that these outcomes tell us much about our current choices. The political parties are a poor proxy for economic policy because the policies espoused by the two parties have changed over time, sometimes dramatically.
Consider trade policies, where just a few decades ago both parties supported free trade agreements – from Ronald Reagan’s espousal of free markets to Bill Clinton signing the North American Free Trade Agreement, to today where Donald Trump made tariffs a centerpiece of his economic policy. If you only look at the party in power, you’re missing important changes in the actual policies being implemented. This is true just over the last few presidencies, let alone over an entire century.
Key takeaways
So as those political emotions run high, it’s worth taking a deep breath and remembering the following when it comes to our portfolios:
- The economy and markets have done well over time under both political parties. Even if we could accurately predict specific political outcomes, this tells us nothing about how to invest in markets.
- Don’t mix politics and investing. Politics are highly emotional and investing based off emotions is rarely a winning strategy.
- Remain diversified and remain invested. There is no empirical evidence that either political party is any better or worse for any particular sector or asset class. What has worked – and what we recommend — is remaining fully invested in a well-diversified portfolio.
Your advisor can help determine how best to diversify your portfolio to suit your needs and goals in addition to answering your questions about investing during an election year. Not a Mercer Advisors client but interested in more information? Let’s talk.
Mercer Advisors Inc. is a parent company of Mercer Global Advisors Inc. and is not involved with investment services. Mercer Global Advisors Inc. (“Mercer Advisors”) is registered as an investment advisor with the SEC. The firm only transacts business in states where it is properly registered or is excluded or exempted from registration requirements.
All expressions of opinion reflect the judgment of the author as of the date of publication and are subject to change. Some of the research and ratings shown in this presentation come from third parties that are not affiliated with Mercer Advisors. The information is believed to be accurate but is not guaranteed or warranted by Mercer Advisors. Content, research, tools and stock or option symbols are for educational and illustrative purposes only and do not imply a recommendation or solicitation to buy or sell a particular security or to engage in any particular investment strategy. For financial planning advice specific to your circumstances, talk to a qualified professional at Mercer Advisors.
Past performance may not be indicative of future results. Therefore, no current or prospective client should assume that the future performance of any specific investment, investment strategy or product made reference to directly or indirectly, will be profitable or equal to past performance levels. All investment strategies have the potential for profit or loss. Changes in investment strategies, contributions or withdrawals may materially alter the performance and results of your portfolio. Different types of investments involve varying degrees of risk, and there can be no assurance that any specific investment will either be suitable or profitable for a client’s investment portfolio. Diversification does not ensure a profit or guarantee against loss. Historical performance results for investment indexes and/or categories, generally do not reflect the deduction of transaction and/or custodial charges or the deduction of an investment-management fee, the incurrence of which would have the effect of decreasing historical performance results. Economic factors, market conditions, and investment strategies will affect the performance of any portfolio and there are no assurances that it will match or outperform any particular benchmark.
This document may contain forward-looking statements including statements regarding our intent, belief or current expectations with respect to market conditions. Readers are cautioned not to place undue reliance on these forward-looking statements. While due care has been used in the preparation of forecast information, actual results may vary in a materially positive or negative manner. Forecasts and hypothetical examples are subject to uncertainty and contingencies outside Mercer Advisors’ control.
Certified Financial Planner Board of Standards, Inc. (CFP Board) owns the CFP® certification mark, the CERTIFIED FINANCIAL PLANNER™ certification mark, and the CFP® certification mark (with plaque design) logo in the United States, which it authorizes use of by individuals who successfully complete CFP Board’s initial and ongoing certification requirements.

Home » Insights » Market Commentary » Politics and Investing Don’t Mix: Insights From Our CIO
Politics and Investing Don’t Mix: Insights From Our CIO
Donald Calcagni, MBA, MST, CFP®, AIF®
Chief Investment Officer
An overview of election returns during election years. Historical market data shows that it’s difficult to predict the impact of politics on an investment portfolio.
As we enter the home stretch of the presidential election between now and early November, it’s worth taking a moment to consider what the data shows us about investment returns, elections, and political parties. It’s a good time to turn to the data, because elections and politics are highly emotional, and when emotions run high, we don’t always make the best investment decisions.
It’s natural for us to deeply believe that our preferred candidate or political party is best for markets and the economy. It’s also natural to believe, when policy platforms are so different, that the impact on markets will be both obvious and significant. It’s easy, and all too common, for our overconfidence biases to have us think that we can somehow reliably predict who will win the election and, subsequently, who the winners and losers in our portfolios might be.
However, all of this is wrong. The data is ambiguous, at best, that one political party is any better than the other for markets or the economy.
The data
Since the 1928 presidential election, the S&P 500 Index has delivered an average annual return of 11.57% during election years and 10.67% the year after the election. More broadly, as the below chart shows, financial markets have generally trended upward under both Democratic and Republican administrations.
Source: Dimensional.
Past performance is not a guarantee of future results. Indices are not available for direct investment; therefore, their performance does not reflect the expenses associated with the management of an actual portfolio. Data presented in the growth of $1 chart is hypothetical and assume reinvestment of income and no transaction costs or taxes. The chart is for illustrative purposes and only and is not indicative of any investment.
Source: S&P data ©2024 S&P Dow Jones Indices LLLC, a division of S&P Global. All rights reserved.
Why might the link between politics and markets be so hard to find?
There is a plethora of reasons why there’s candidly no reliable correlation between which party controls the White House and market returns. The president is but one branch of government and it’s ultimately Congress that writes and passes legislation and sets spending policy.
There’s inevitably a gap between what a president proposes in a policy platform, and what they’re subsequently able to enact. Even when Congress and the White House are controlled by the same party, they don’t always agree on how to enact their policies.
Many key economic policies remain largely unchanged from one presidency to the next.
Some key policymakers, such as the Federal Reserve’s governors, are appointed to terms that don’t line up with the political calendar. Even when the occupant of the White House changes, there’s much about the economy that remains the same.
Are there any reliable historical patterns that emerge?
It’s possible to cherry pick historical data to find something that might support your cause. Consider the first chart, below. It’s relatively rare for both Congress and the White House to be controlled by the same party (the government has been divided 61% of the time). But during those periods of Democratic control, real GDP has grown 4% on average, vs. just 2.8% during the periods of Republican control.
But then consider the second chart – under periods of unified Republican control, the market has increased 12.9% vs. just 9.3% under Democrats.
Source: Mercer Advisors Q3 Market Outlook
Note: Indexes are not available for direct investment. Past performance is not a guarantee of future results.
Source: BEA, Standard & Poor’s, FactSet, J.P. Morgan Asset Management. Data is calendar year. Guide to the Markets – U.S. Data are as of January 18, 2024.
What’s important to takeaway here is that none of this implies any reliable cause and effect relationship between party control and market returns or GDP growth. These periods of unified government leave us only a small sample size. And remember that control of Congress can even change in between election cycles, as happened in 2001 when Senator Jim Jeffords of Vermont left his party, causing control of the Senate to flip.
In addition to being a small sample size, it might be wrong to conclude that these outcomes tell us much about our current choices. The political parties are a poor proxy for economic policy because the policies espoused by the two parties have changed over time, sometimes dramatically.
Consider trade policies, where just a few decades ago both parties supported free trade agreements – from Ronald Reagan’s espousal of free markets to Bill Clinton signing the North American Free Trade Agreement, to today where Donald Trump made tariffs a centerpiece of his economic policy. If you only look at the party in power, you’re missing important changes in the actual policies being implemented. This is true just over the last few presidencies, let alone over an entire century.
Key takeaways
So as those political emotions run high, it’s worth taking a deep breath and remembering the following when it comes to our portfolios:
Your advisor can help determine how best to diversify your portfolio to suit your needs and goals in addition to answering your questions about investing during an election year. Not a Mercer Advisors client but interested in more information? Let’s talk.
Mercer Advisors Inc. is a parent company of Mercer Global Advisors Inc. and is not involved with investment services. Mercer Global Advisors Inc. (“Mercer Advisors”) is registered as an investment advisor with the SEC. The firm only transacts business in states where it is properly registered or is excluded or exempted from registration requirements.
All expressions of opinion reflect the judgment of the author as of the date of publication and are subject to change. Some of the research and ratings shown in this presentation come from third parties that are not affiliated with Mercer Advisors. The information is believed to be accurate but is not guaranteed or warranted by Mercer Advisors. Content, research, tools and stock or option symbols are for educational and illustrative purposes only and do not imply a recommendation or solicitation to buy or sell a particular security or to engage in any particular investment strategy. For financial planning advice specific to your circumstances, talk to a qualified professional at Mercer Advisors.
Past performance may not be indicative of future results. Therefore, no current or prospective client should assume that the future performance of any specific investment, investment strategy or product made reference to directly or indirectly, will be profitable or equal to past performance levels. All investment strategies have the potential for profit or loss. Changes in investment strategies, contributions or withdrawals may materially alter the performance and results of your portfolio. Different types of investments involve varying degrees of risk, and there can be no assurance that any specific investment will either be suitable or profitable for a client’s investment portfolio. Diversification does not ensure a profit or guarantee against loss. Historical performance results for investment indexes and/or categories, generally do not reflect the deduction of transaction and/or custodial charges or the deduction of an investment-management fee, the incurrence of which would have the effect of decreasing historical performance results. Economic factors, market conditions, and investment strategies will affect the performance of any portfolio and there are no assurances that it will match or outperform any particular benchmark.
This document may contain forward-looking statements including statements regarding our intent, belief or current expectations with respect to market conditions. Readers are cautioned not to place undue reliance on these forward-looking statements. While due care has been used in the preparation of forecast information, actual results may vary in a materially positive or negative manner. Forecasts and hypothetical examples are subject to uncertainty and contingencies outside Mercer Advisors’ control.
Certified Financial Planner Board of Standards, Inc. (CFP Board) owns the CFP® certification mark, the CERTIFIED FINANCIAL PLANNER™ certification mark, and the CFP® certification mark (with plaque design) logo in the United States, which it authorizes use of by individuals who successfully complete CFP Board’s initial and ongoing certification requirements.
Explore More
Implications of The Market Response To the Election: Insights From Our CIO
Energy Prices on the Eve of the Election: Insights From Our CIO
Is There a Threat to the Dollar From a New BRICS Currency?